
The Pricing report inside Google Merchant Center has evolved into a central tool for retailers using Google Shopping. It provides price benchmarking, competitiveness insights, and pricing guidance derived from Google’s product ecosystem. While it appears straightforward, the feature indicates a broader shift in how Google is standardising e-commerce data and shaping pricing behaviour.
Here is a structured analysis covering its history, mechanics, best use cases, and how not to use it.
History of the Pricing Feature
Google’s pricing intelligence tools in Merchant Center have had multiple iterations since 2020. Early versions appeared as price benchmark and price competitiveness reports, initially released to a bespoke and high-spending group of merchants. These early tools compared a retailer’s product prices against aggregated market prices derived from Google Shopping listings. Coverage was limited, product matching was inconsistent, and the interface gave little insight due to a lack of trust.
Between 2021 and 2022, Google added more businesses and improved product matching using GTINs and structured product attributes. Pricing insights became more closely tied to Shopping performance measures such as visibility and potential for impressions. This signalled Google’s intention to influence merchant pricing behaviour.
Fast forward to the 2024 rollout, and pricing insights were integrated into a central Analytics hub. The modern “Analytics → Pricing” report introduced clearer price competitiveness indicators, and they rolled it out to extra merchants.
By 2025, Google migrated from the older performance systems to a new price competitiveness data model with improved consistency and expanded reporting capabilities. Today’s Pricing report represents the latest stage in Google’s ongoing shift toward structured e-commerce intelligence.
How the Pricing Report Works
The Pricing report compares a merchant’s product price against aggregated pricing data from other retailers selling comparable products within Google’s ecosystem. The line comparable says it all. It won’t always be the same product as yours. The system relies heavily on product matching, which uses identifiers such as Global Trade Item Numbers (GTINs), product titles, attributes, and structured data.
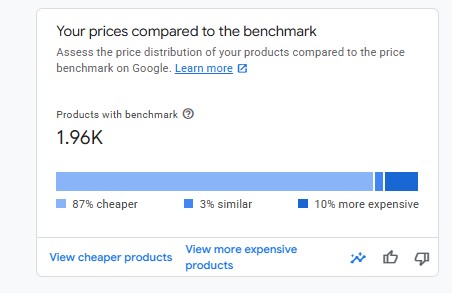
Google calculates benchmark price ranges using prices it has observed from competing merchants who advertise or list similar products on Google Shopping, after matching the products. The report typically shows the product’s price benchmark as being “cheaper”, “similar”, or “more expensive” than the benchmark. Some views also provide price ranges or competitiveness ratios.
Logically, they aggregate and anonymize the data. So, your Merchant Center data remains secure. The data is directional rather than precise figures.
The data is not real-time. Google collects prices through merchant feeds, structured data from websites, and its own crawling network. This means the reported benchmark reflects the average of past pricing.
The report requires a critical mass of products appearing in ad auctions and websites before benchmarks appear. As a result, commoditised products with strong GTIN coverage—such as electronics or branded goods—tend to produce more accurate pricing insights than niche or custom items. If your store has niche products, you may not see any insights.
The report may also generate pricing suggestions, which recommend adjustments based on historical auctions. Keep in mind that these suggestions do not account for your margins, inventory strategy, or brand positioning.
Overall, the system functions as a probabilistic price-comparison model within Google’s retail ecosystem.
Best Use Cases
The Pricing report is most effective as a diagnostic and monitoring tool. Its strongest use case is identifying significant pricing gaps for high-volume or strategically important products. Retailers can detect when core products are priced above market benchmarks, which may explain weak performance.
It is especially useful for merchants selling standardised, widely distributed products such as consumer electronics, appliances, or branded retail goods. These products have reliable GTIN coverage and solid market competition, producing more accurate benchmark comparisons. For these SKUs, the report can validate your pricing strategy and help preserve your competitiveness.
Another strong application is prioritisation. Large retailers with thousands of SKUs can use pricing insights to identify which products require attention, directing optimisation efforts toward items with the greatest price gap.
The report also supports cross-team decision-making. Marketing, merchandising, and pricing teams can use the data to contextualise advertising performance, understand competitive pressures, and evaluate whether pricing contributes to changes in traffic or conversion rate.
How not to use it
Because the benchmark data is aggregated, delayed, and limited to Google’s ecosystem, relying on it for live price adjustments may lead to unstable or unprofitable pricing.
It is also unsuitable for differentiated products such as private-label goods, custom products, bundles, or services with unique propositions. In these cases, product matching may be unreliable or impossible, producing misleading comparisons that fail to reflect actual market competition.
Takeaway
Despite the many caveats, this tool is useful for retailers to gauge where their prices sit amongst a busy market. The more competitive your vertical, the more data you should expect to see.